Home About us Contact us Protuner Loop Analyser & Tuner Educational PDFs Loop Signatures Case Histories
Michael Brown Control Engineering CC
Practical Process Control Training & Loop Optimisation
CONTROL LOOP CASE HISTORY 165
INTERPRETING TESTS ON LOOP PROBLEMS
I have published a lot of articles showing problems in control loops with figures showing the tests conducted to determine the problems. I thought that as a change in this article I would suggest that readers first study the figures and try and determine what can be determined from the tests.
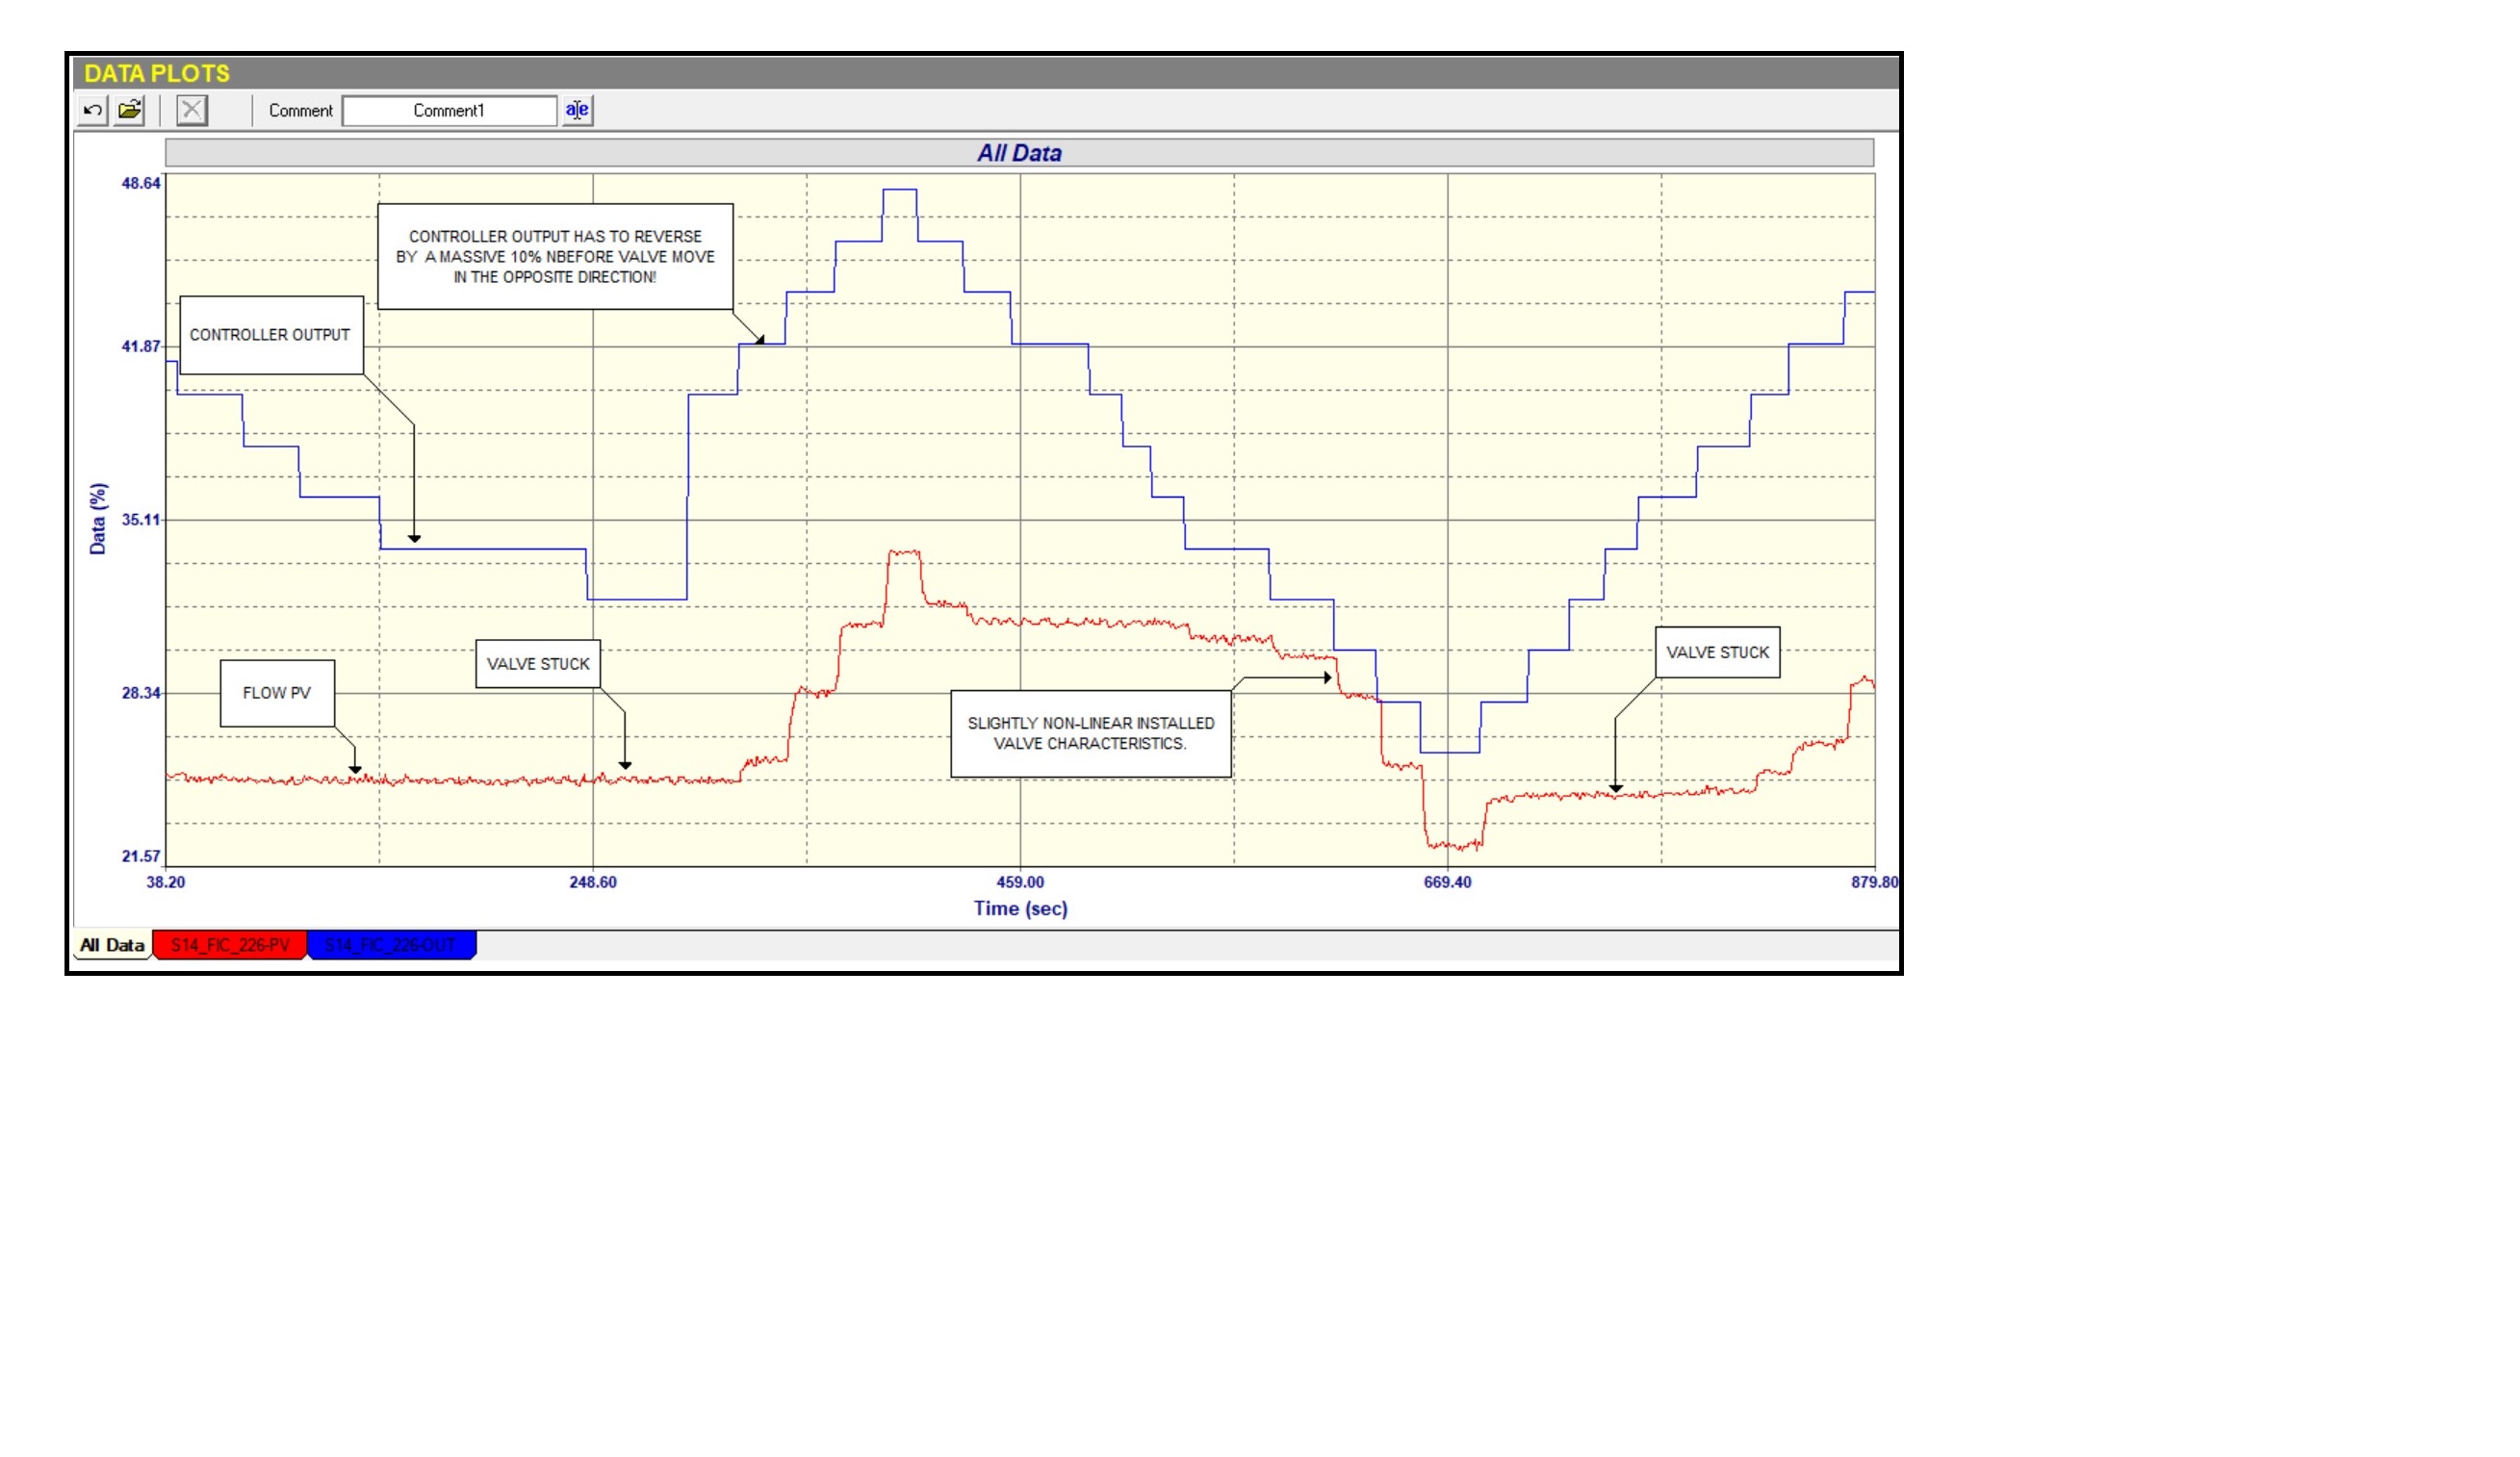
Figure 1 is an “as-found” closed loop test (i.e. a test with the controller in automatic and using the existing tuning parameters) on an air flow loop in a metallurgical plant in Portugal where I recently did some work. Have a good look at it and see what you think is wrong. Then carry on reading below.
This is what can be determined from the test:
Figure 1.
1. It can be seen that the PV (process variable) never actually settles at setpoint, and that after the SP (setpoint) changes it still does not get there and slowly ramps towards the SP. This is an indication on a fast process like flow that the integral setting is far too slow.
2. On the SP changes it can be seen that there is a big kick in the PD (controller output) and then the PV tends to cycle, with about 1.5 cycles on the SP change upwards, and about 2 full cycles when the SP was stepped back down. This indicates two things are wrong:
a. The proportional gain is far too big and the tuning is actually close to instability.
b. There is a strong possibility that the valve has non-linear installed characteristics, so the response is slower in the higher ranges and faster as the PV gets lower.
3. The PV and the PD are working at extremely low values in a region well below 10%, which is in fact the region in which they normally operate. Working so low down is very bad practice. Firstly most flow measuring methods do not work well at very low ranges, and may in fact be terribly inaccurate and possibly give incorrect readings. This obviously does depend largely on the particular type of flow measurement being used. In this case it was a vortex shedding flow meter. The specifications for this meter were not available on site, but I would strongly suspect that the measuring span of the meter is far too wide. Secondly as far as the valve is concerned it is a well known general “rule of thumb” that under normal operating conditions the valve should operate above the 20% mark. All sorts of control problems can occur with valves working close to seat. It is also pretty obvious that the valve must be largely oversized which is a bad thing for various reasons that have been discussed in other articles.
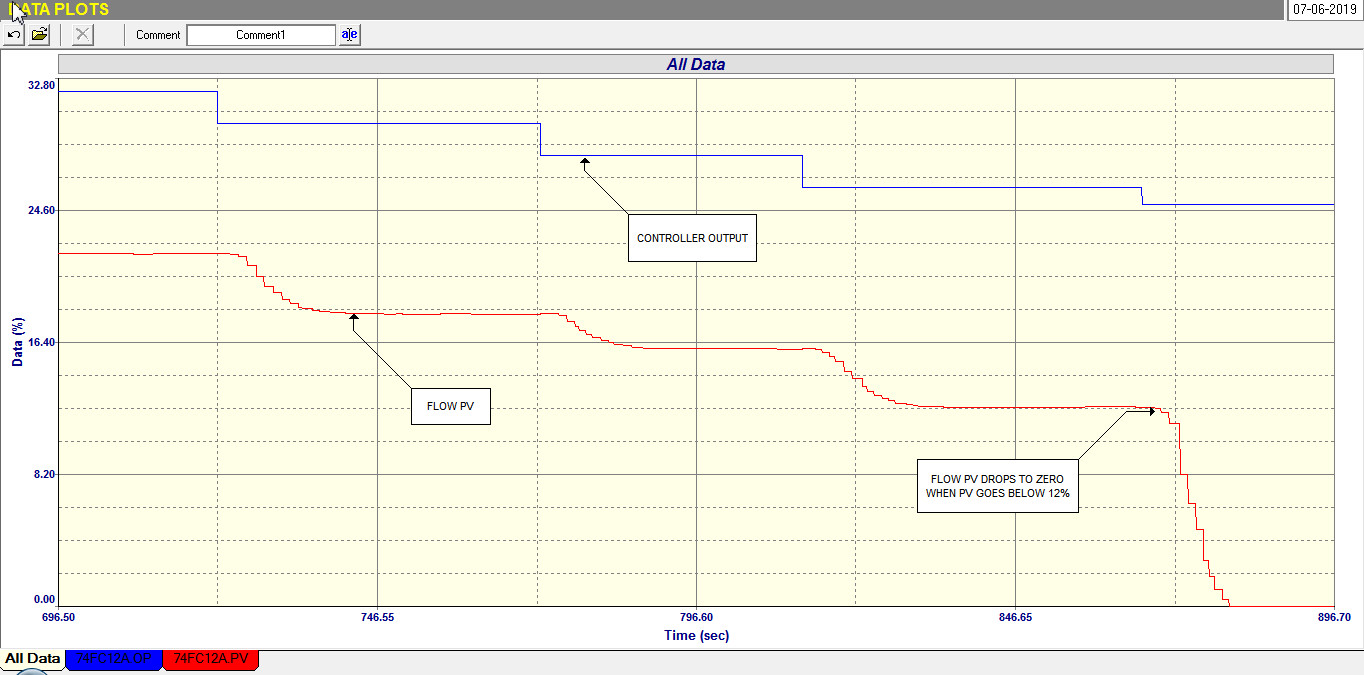
Figure 2 shows the open loop test on this loop with equal step changes in PD being made in both directions with the controller in manual. Unfortunately it is hard to actually determine deadtime and lag times from the figure without being able to zoom in and see more details, but let it suffice to say that if you could you would have found that the deadtime was about 5 seconds and time constant about 9 seconds which was repeatable on most of the steps. Bearing this in mind and again examining the figure what would you deduce?
Figure 2
This is what you should be able to come up with:
1. The response in the first 3 steps was rather slow compared with subsequent steps which would indicate that the valve was pretty sticky and the loosened up a bit. The steps then also gave a rather peculiar response for a flow loop with a sudden rise in the PV and the slowed down taking quite a while to get to the final position. This again would indicate stickiness in the valve with the positioner forcing the valve to the final position.
2. Normally flow loops with pneumatically actuated valves have deadtimes around 1- 2 seconds and time constants also around the same values. The excessive deadtime and slow time constant in this particular case again would indicate that the valve is really badly sticky and that the positioner is working hard to get the valve to the right place.
3. The 3 steps downwards in the middle of the test confirmed the really quite bad installed non linearity of the valve with the last step being almost 3 times bigger than the first.
The controller was then tuned using the largest steps at the low end of the range.
The original tuning was P = 3, and I = 120 seconds/repeat. This confirms the original deductions made when looking at the “as-found” closed loop test, i.e. too high a gain, and too long an integral.
The new tuning was P = 0.9, and I = 10 seconds/repeat.
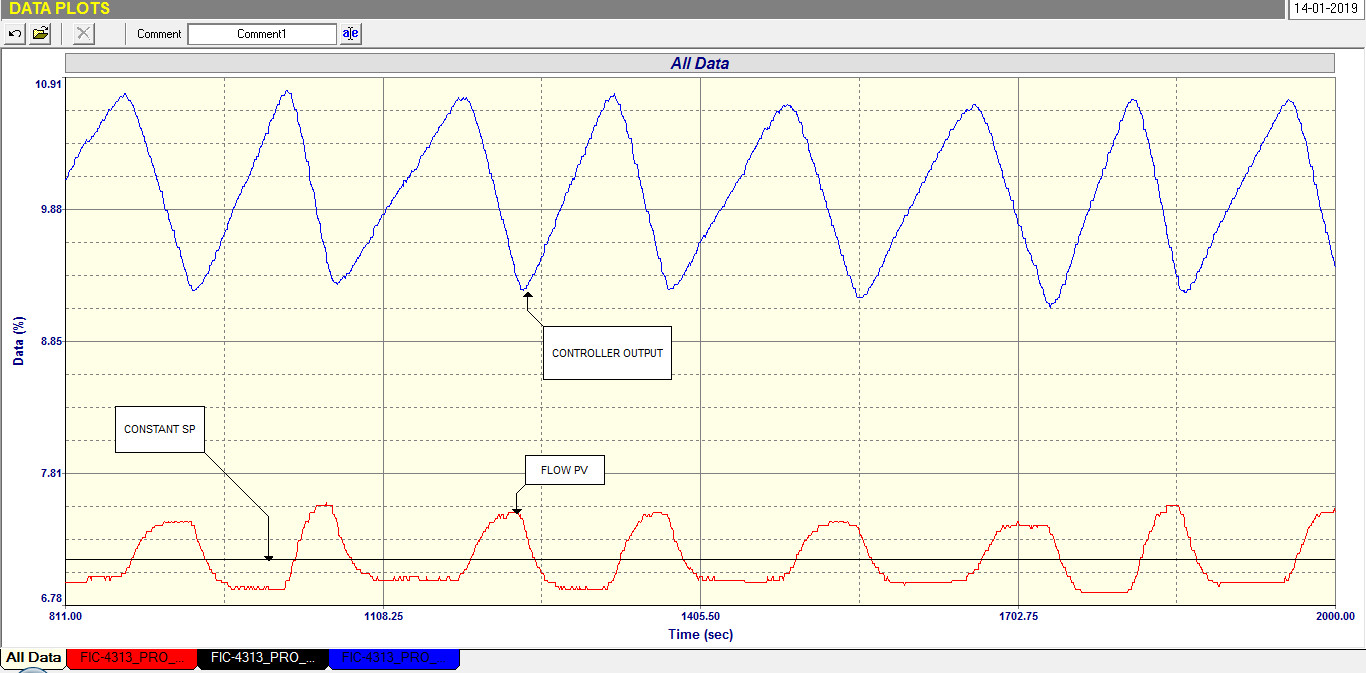
Figure 3 shows the loop running with this new tuning in automatic with steady SP. There is a small cycle on the loop. The question is: Is this instability due to bad tuning or is there another reason?
Figure 3
Generally most people with little knowledge of practical process control would say that it is definitely due to bad tuning, and this is probably why the original tuning was made to operate so slowly, so didn’t cycle. However the integral was so long it never got to setpoint, so the person who tuned tried to compensate by increasing the gain.
The cycle is in fact a fairly typical “stick-slip” cycle which I have discussed in quite a few previous articles. It is caused by the fact that the positioner cannot get the valve to the exactly right position. The valve sticks and then the integral action in the controller, which now with new and correct tuning, is relatively fast, keeps ramping until the valve does actually move. This has caused the positioner to push too much pressure into the actuator, which then causes the valve to “slip”, and overshoot the set point. The whole thing then repeats in the opposite direction. The stick-slip cycle is immediately identified by the “saw-tooth” waves on the controller output, which are more or less pure ramps with the integrator integrating a constant error.
In reality the cycle which looks terrible in the figure due to the expanded scale, has an extremely small amplitude of about 0.5%, and can be completely ignored. It will not affect the life of the valve to any noticeable extent. Also if the recommendations are followed and if the valve is serviced, the cycle would probably disappear.
It is really interesting the facts that can be deduced by carrying out these analytical and tuning tests and being able to interpret what can be seen.