Home About us Contact us Protuner Loop Analyser & Tuner Educational PDFs Loop Signatures Case Histories
Michael Brown Control Engineering CC
Practical Process Control Training & Loop Optimisation
CONTROL LOOP CASE HISTORY 167
TEST YOUR ANALYTICAL CAPABILITIES
Answer to Question at End of Case History 166: In the last issue of this article I suggested you try and see what was not too good about the level control which itself was working very well. The answer is that the valve is probably largely oversized. The process was running under normal load conditions, and assuming that the valve was calibrated correctly to the controller output, then the valve at the level balance point was operating at about 14%. This is far too low for good valve practice.
It has been a long established good rule of thumb that control valves should under normal operating conditions always work above 20% of opening. Problems (particularly cycling and non-linearity) can occur when the valve is close to seat. The reasons for this have been detailed in the articles on final control elements in my Loop Signature series.
In this case one could really encounter severe problems if the load was reduced considerably as the balance point of the level could be where the valve was almost completely closed.
The following is also to test your analytical powers. Please try and see what you can see from the tests, and then you can refer to the things I deduced at the end of the article.
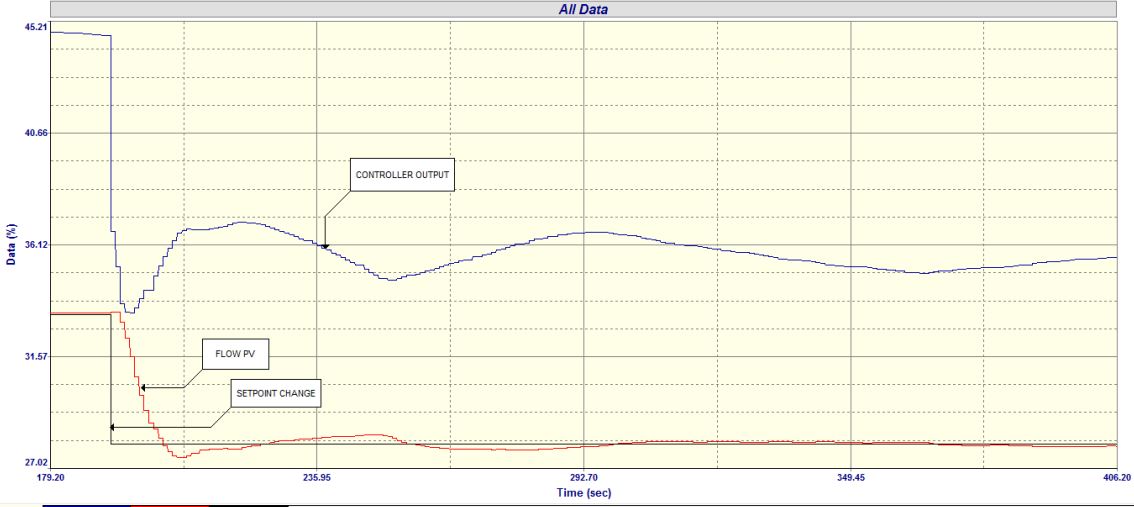
Figure 1 is the recording of a closed loop “As Found” test on a flow loop in a minerals processing plant. This test consists of a setpoint change with the original tuning as done by the plant C&I personnel.
The tuning in the controller was P(Gain) = 0.25 and I = 25 seconds/repeat. (The controller algorithm is the classical Ideal where the gain is multiplied through the integral.)
One can see at least 3 things that can be seen in the recording which would indicate a valve problem. Can you identify them?
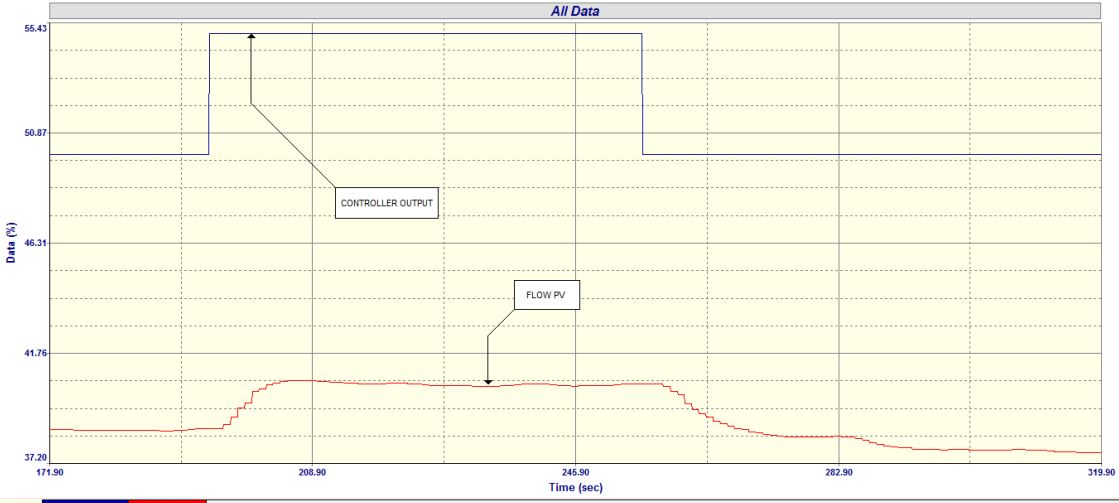
Figure 2 is a portion of an open loop test on the same loop. In this test one of the problems seen in the first test is confirmed.
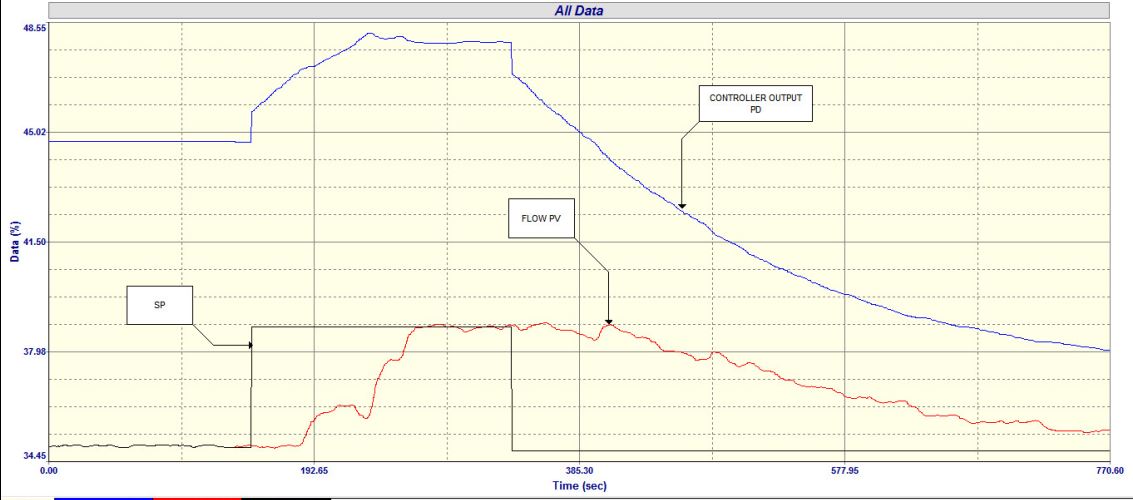
Figure 3 is a “Final” closed loop test with our new tuning of P(Gain) = 1.2 and I = 6 seconds/repeat. The test shows the response when a 5% SP change is made. The test definitely again confirms the valve problem. There is a small cycle appearing after the setpoint change. Is this due to too “hot” a tune or is it caused by another thing?
Deductions That Can Be Made From The Tests:
1. Closed Loop “As Found” Test – Figure 1:
a) The tuning is pitifully slow with far too small a gain and a terribly slow integral. In both the setpoint (SP) step changes, up and then down, one can clearly see on the controller output (PD) the initial proportional step which takes place immediately on the SP step, and it is then followed by the very slow ramp of the integral action, with the ramp rate decreasing as the process variable (PV) gets closer to the SP.
b) The valve is very sticky which can be seen by the extremely long deadtime before the PV starts moving after the SP change. This is because the control action is so slow and the controller output (PD) has to move quite a way before the energy in the actuator is sufficient to get through the stickiness and start moving the valve. (Actually at this stage one is not sure if it is actually valve stickiness or hysteresis, but the deductions made from the other two tests would rather confirm that it is stickiness.)
c) After the SP is stepped down it can be seen that it moves quite far below the original PD value at the start of the test, and in actual fact the PV has still not reached SP again at the end of the test. This is usually a sign of hysteresis, but can also be caused by stickiness which can sometimes be greater on one direction of valve movement, and less on the reverse direction. However it is definite confirmation that the valve is not operating well.
2. Open Loop Test – Figure 2:
This test normally shows valve problems very clearly, but surprisingly in this case it does not really show the problems. The reason for this is that the test involves making quite a big step on the PD, and this acts like a “shock” input to the valve and in this case the valve is driven quickly through the stickiness, so it looks quite good. However there is one indication of the stickiness in the test. It can be seen on the second step downwards, that the flow came down and then levelled off for quite a while (at about 270 seconds), and then it moved down a bit, and eventually settled out, at a value which a slightly lower than the original PV value at the start of the window - before the PD step upwards. (This is sometimes referred to as “Negative Hysteresis”.) What has actually happened is that on the reversal of the PD, the valve has moved down and has stuck before reaching the correct position. The positioner has then started trying to move the valve further down, and in overcoming the stiction, it has “pumped” too much pressure into the actuator so that when the valve did move again it moved too far.
3. Final Closed Loop Test – Figure 3:
This test shows that the feedback control with decent tuning does a pretty good job of getting the PV to SP despite the valve problem. However it does also show clearly that a small “stick-slip” cycle is occurring due to the valve’s stickiness. Many people mistakenly believe that a cycle like this is due to bad tuning, but it is definitely caused by the valve’s stickiness, and the controller and positioner trying to move it to exactly the correct position.
The test also presents a powerful illustration of how remarkably well feedback control is in overcoming problems, especially with good tuning.