Home About us Contact us Protuner Loop Analyser & Tuner Educational PDFs Loop Signatures Case Histories
Michael Brown Control Engineering CC
Practical Process Control Training & Loop Optimisation
CONTROL LOOP CASE HISTORY 179
SOME UNUSUAL MEASUREMENT AND CONTROL PROBLEMS
As I have often mentioned. many people do not know how to set up control systems on PLC/SCADA systems properly, and errors in control and measurement can result. Admittedly I have found similar problems in DCS control systems, but very much more rarely. I think it is because DCS systems are usually found in plants where there is a strong control background and people in the manufacturing teams who have much better understanding of control and measurement, have set up proper protocols when dealing with measurement and control. Also DCS systems have many more safeguards built into them to prevent users making mistakes than do most PLC/SCADA systems.
The example given in this article illustrates some mistakes which had been made by the system integrators and control engineers on a control loop in a metals extraction plant which used a well known make of PLC and SCADA for their controls. Typically the C&I staff in the plant had not picked the errors up, and had been working for years with the problems. The loop in question was an important nitrogen flow control feeding a hydrogen sulphide reactor.
Whenever one optimises a control loop, it is essential that you firstly discuss the control in its entirety with the people who look after the control side of things, and also with people who really understand the process. In many plants they are the same people, but very often I find that many people on the control side do not really understand the process, and vice versa, people on the process side often don’t understand controls. Typically we investigate and discuss the following things:
1. Details of the process.
2. The configuration of the control loop.
3. The control strategy.
4. The purpose of the control.
5. How quickly the control must react. For example sometimes they want it as fast as possible, or maybe it must really be very slow so as not to disturb things downstream, or possibly it doesn’t really matter as the control isn’t that important, and it is fine if it operates more or less in the right region.
6. What external factors can affect the control, and can this loop affect other controls or processes.
7. Details of measuring system.
8. Type of valve.
9. Problems that are being encountered with this control.
In the case we are discussing here, the two main problems encountered by the operators and process engineers were firstly that they said the readings didn’t really tie up with laboratory readings and mass flow balances, and secondly the control was not satisfactory, being slow and hardly ever getting to SP (setpoint).
On investigating the measurement range and setup in the PLC, it was discovered that the range was incorrect. The actual flow transmitter range was in fact set to 0 - 1125 m3/h but the figure that had been programmed into the controller’s PV (process variable input) was 0-1200 m3/h. However on top of this, the transmitter signal coming into the PLC was first divided by 1.25 as, the process people wanted to see a mass flow range of 0 -900 Nm3/h, and not volume flow figures. This explained the discrepancy observed by the process people.
The next problem observed when we started doing the testing was that the flow signal was running at about 5% of the full scale reading. This is potentially very bad. As a general rule very few flow measurements are accurate, and reliable so low down in the range, and may possibly even be incorrect. This does depend on the type of measurement and the transmitter and its rangeability. Unfortunately in this case at the time of the testing, no one was available who could advise on the details and specification of the transmitter.
The first live test carried out on the loop is nearly always a closed loop test “as found” where setpoints changes are made on the loop with the original tuning, which was P = 0.5, and I = 10 sec/repeat. There also was a lag filter with a time constant of 2.45 seconds inserted in the PLC before the PV input to the controller. The test is shown in Figure 1 and the following observations were made:
Figure 1
a) Transmitter is working far too low down as discussed earlier.
b) The tuning is incredibly slow and takes far too long to follow setpoint.
c) Although the filter is relatively small there is no need for it, as filters introduce other problems. (Discussed in other articles).
The open loop test (in manual) is shown in Figure 2. The filter has been removed. It can be seen:
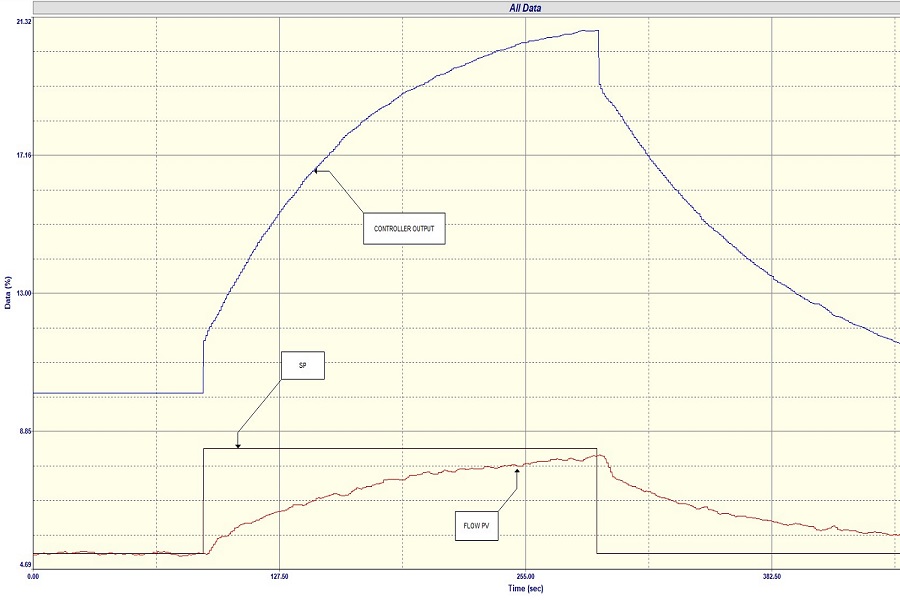
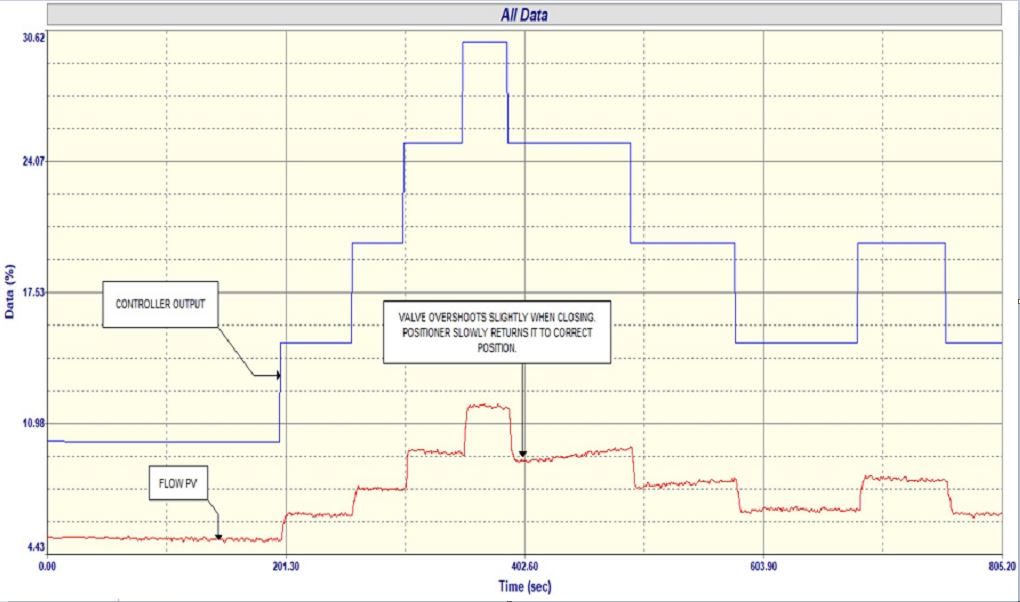
Figure 2.
a) The process gain (the ratio of the steps in PV to PD, the controller output) is about 0.3 which would indicate the transmitter is probably over spanned by a factor of three.
b) There is very slight non-linearity in the installed characteristics, which is not serious.
c) Valve has an overshoot when moving in the closing direction. This is not particularly serious but could cause a stick-slip cycle when the loop is in automatic with better tuning. Possible it could be eliminated by tuning the positioner a little better.
d) Apart from this the valve is working very well.
The controller was then tuned using the largest step in PV (for safety). The Protuner gave a medium tune of P = 0.4, and I = 1 sec/repeat.
Figure 3
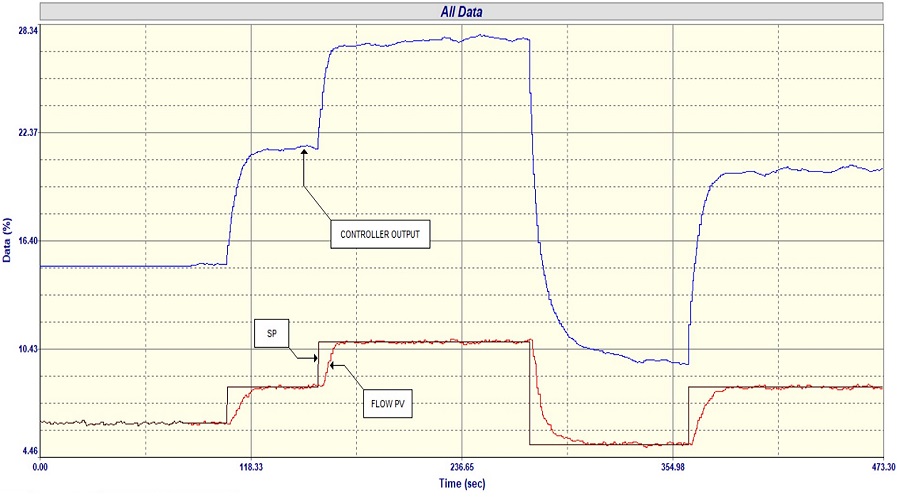
The final closed loop test with the new tuning is shown in Figure 3. It can be seen how well the control now works, and it is about 15 times faster than the original tuning.
This is an example of what we often find when performing loop optimisation where lack of knowledge of the practicalities of control results in underperformance, and in this case imparting incorrect information.